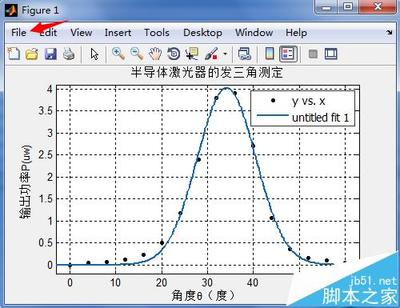
非线性最小二乘优化在曲线拟合、参数估计等问题中有着广泛的应用。例如,我们要拟合一系列观测数据(t,y),拟合函数为F(t,x),他是x的非线性函数。对于这种最小二乘曲线拟合问题,可以通过Matalb优化工具箱中的lsqcurvefit命令求解,可以根据实际问题进行曲线拟合。
例题在工程实验中,测得下面一组数据。求系数a、b、c、d,使得函数为表中数据的最佳拟合函数。
f(t)=a+b・sin(t)+c・cos(t)+dt3
观测数据表――――――――――――――――――――――――――――――――――
t? |? ?? 0??? 0.5?? ? 1? ?? 1.5?? ?? 2? ?? 2.5??? ? 3? ?? 3.5???? 4
――――――――――――――――――――――――――――――――――
y? |???? 0??? 3.4??? 4.1??? 4.6? ?? 5.9??? 6.9? ?? 8.1? ? 9.8? ?? 11
――――――――――――――――――――――――――――――――――
方法/步骤
function f=example8_15(x,ti)
n=length(ti);
for i=1:n
??? f(i)=x(1)+x(2)*sin(ti(i))+x(3)*cos(ti(i))+x(4)*ti(i)^3;
end
>> ti=[0??? 0.5???? 1???? 1.5????? 2???? 2.5????? 3???? 3.5???? 4];
>> yi=[0??? 3.4??? 4.1??? 4.6???? 5.9??? 6.9???? 8.1??? 9.8???? 11];
>> x0=[1 1 1 1]';???? %初始点选为全1向量
>> [x,resnorm,residual,exitflag,output,lambda,J]=lsqcurvefit(@example8_15,x0,ti,yi)
%%%%%%%%%%%%%%%%%%%%%%%%%%%%%%%%%%%%%%%%
Optimization completed because the size of the gradient is less than
the default value of the function tolerance.
<stopping criteria details>
x =
??? 1.8706
??? 2.7714
?? -1.0477
??? 0.1708
resnorm =
??? 2.9080
residual =
? Columns 1 through 7
??? 0.8228?? -1.0989?? -0.2927??? 0.5373??? 0.2929??? 0.1372?? -0.1897
? Columns 8 through 9
?? -0.5977??? 0.3887
exitflag =
???? 1
output =
??? firstorderopt: 6.6428e-08
?????? iterations: 2
??????? funcCount: 15
用Matlab做线性拟合方法_拟合
???? cgiterations: 0
??????? algorithm: 'trust-region-reflective'
????????? message: [1x425 char]
lambda =
??? lower: [4x1 double]
??? upper: [4x1 double]
J =
?? (1,1)?????? 1.0000
?? (2,1)?????? 1.0000
?? (3,1)?????? 1.0000
?? (4,1)?????? 1.0000
?? (5,1)?????? 1.0000
?? (6,1)?????? 1.0000
?? (7,1)?????? 1.0000
?? (8,1)?????? 1.0000
?? (9,1)?????? 1.0000
?? (2,2)?????? 0.4794
?? (3,2)?????? 0.8415
?? (4,2)?????? 0.9975
?? (5,2)?????? 0.9093
?? (6,2)?????? 0.5985
?? (7,2)?????? 0.1411
?? (8,2)????? -0.3508
?? (9,2)????? -0.7568
?? (1,3)?????? 1.0000
?? (2,3)?????? 0.8776
?? (3,3)?????? 0.5403
?? (4,3)?????? 0.0707
?? (5,3)????? -0.4161
?? (6,3)????? -0.8011
?? (7,3)????? -0.9900
?? (8,3)????? -0.9365
?? (9,3)????? -0.6536
?? (2,4)?????? 0.1250
?? (3,4)?????? 1.0000
?? (4,4)?????? 3.3750
?? (5,4)?????? 8.0000
?? (6,4)????? 15.6250
?? (7,4)????? 27.0000
?? (8,4)????? 42.8750
?? (9,4)????? 64.0000
%%%%%%%%%%%%%%%%%%%%%%%%%%%%%%%
>> xi=0:0.1:4;
>> y=example8_15(x,xi);
>> plot(ti,yi,'r*')
>> grid on
>> hold on
>> plot(xi,y)
>> legend('观测数据点','拟合曲线')
>> title('最小二乘曲线拟合')
 爱华网
爱华网