下面是小编整理的高考英语图表作文,以供大家学习参考。
怎样写图表分析作文纵观近几年高考,英语书面表达大致分为材料作文、图表作文和开放作文。且材料作文逐渐被图表作文取代,图表分析作文就是将数据、图像所包含的信息,转化为表意的说明文字。图表分析作文通常比较复杂,学生不仅要弄清提示,还要看懂所给的图表和数据。由于这类试题提示内容少,信息点分散,审题时一定要领会作者的出题意图,弄清主题再动笔:1.单纯描述解释图表信息,按图表所示内容如实表达,不加评论。2.通过叙述图表(或图画)中的内容和数字变化来分析原因,发表议论。
高考英语图表作文(一) 柱状图(BAR CHART)人们日常生活中事物的变化情况通常可以用宽度相等的柱状图形来表示,柱状图的高度差别用来说明事物的动态发展趋势,同时要注意图例说明和坐标刻度所提示的信息。
例:你们班会的讨论主题是“上大学是高中生唯一的出路吗?”请你根据下面图表及汉语提示,写一篇短文,并阐述你的个人观点。
提示:1.增长学识,提高素养,利于择业。
2.成功的路不只一条。
3.学费高,就业难。
要求:1.词数:100~120左右。
2.开头语已为你写好(不计入词数)。
3.参考词汇:tuition n.学费 qualities n.素养
【高考英语图表作文解题分析】柱状图是高中英语课本中常见的图形,要求学生通过柱状图图中数据和提示内容写一短文,属于比较、对照类。也可根据提示写为议论文。通常我们采取三段式写法:
第一段:描述图表,得出结论。
第二段:紧扣主题,根据图表比较分析原因,论证结论。
第三段:发表议论,提出自己的看法。
【高考英语图表作文提炼要点】分析柱状图数据信息。从图中可看出,黑色代表想上大学,占大多数,约60%;浅黑色代表无所谓,占约30%;白色代表不想上大学,占约10%。
One possible version
Is It The Only Way Out To Go To College?
We had a discussion about whether it is the only way out for senior students to go to college.Views vary from person to person.
The majority of us consider it very necessary to go to college.They think it can widen their knowledge and improve their qualities.Only in this way can they find better jobs after graduation.Very few students,that is about ten percent of the students,think it no use going university,because the tuition is too high for their family to afford.What's more,it's rather hard for college graduates to seek satisfactory jobs.Thirty percent of the students,however,believe “All roads lead to Rome.”Therefore it doesn't make any difference whether they go to college or not.
In my opinion,we can receive a better education at college so that we can serve our motherland.
【高考英语图表作文语言亮点】①词汇。如:consider,widen,afford,seek,satisfactory。
②句式。如:形式宾语:The majority of us consider it very necessary to go to college.
倒装:Only in this way can they find better jobs after graduation.
主语从句:it's rather hard for college graduates to seek satisfactory jobs.
谚语:All roads lead to Rome.
③过渡词。如:that is about ten percent of the students,what's more,however,in my opinion。
【高考英语图表作文技巧点拨】1.读懂柱状图坐标刻线及图例说明与文字,比较柱状高低和颜色表示内容及数据。
2.学会看趋势、找规律,从整体看图表有何发展变化,找出特点、规律。
3.引用图表包含信息,使你的文章“由图而发”,言之有据。
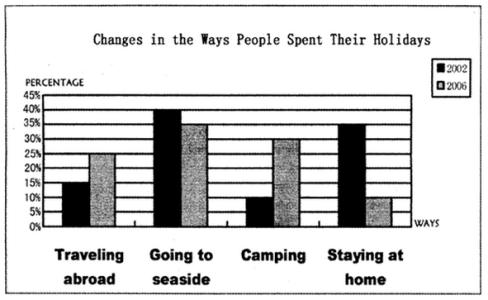
【高考英语图表作文常用句式】1. As can be seen from the chart,... As is shown in the chart,...
2. The chart shows that about 60 percent of students want to go to college...
3. From the graph/data/results/information above,it can be seen/concluded/shown /estimated...
4.The graph shows the changes in the number of...over the period from...to...
5.Compared with...,the number of the students of...
 爱华网
爱华网