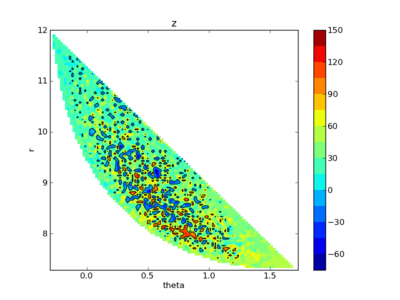
另外,若想获得某一等高线处的具体数据,则用[c,h]=contour(X,Y,Z,[i,i]).其中c中即包含等高线的信息,即对应Z=i处的xdata向量和ydata向量。直接调用c就可以了,一般情况下xdata向量和ydata向量过长,显示的时候是分段显示的dim1,dim2...表示接下来一段显示的[xdata,ydata]的长度,如下:
C = [value1 xdata(1) xdata(2)... value2 xdata(1)xdata(2)...;
dim1 ydata(1)ydata(2)...dim2 ydata(1)ydata(2)...]
为方便查看,调用C'更清晰。
另外,读取任一matlab的fig图的数据的方法如下:

open('D:design_softworkw=60.fig'); %打开图
Ih=findall(gca,'type','line');%获得曲线的句柄
xc=get(Ih,'xdata');
yc=get(Ih,'ydata');
另外注意:contour(Z) draws acontour plot of matrix Z, where Z is interpreted as heights withrespect to the x-y plane. Z must be at least a 2-by-2 matrix. Thenumber of contour levels and the values of the contour levels arechosen automatically based on the minimum and maximum values of Z.The ranges of the x- and y-axis are[1:n] and [1:m], where [m,n] = size(Z).不要颠倒了!故调用时:
i=1;
for a4=-a:delta:a
k=1;
for a5=-b:delta:b
f(i,k)=int0(a4,a5);%给二维矩阵f赋值,调用int0函数
k=k+1;
end
i=i+1;
end
a4=-a:delta:a;
a5=-b:delta:b;
meshgrid(a4,a5);%meshgrid产生(a4,a5)网格
[c,h]=contour3(a4,a5,f',[0,0]);%将f转置一下才能和meshgrid(a4,a5)相匹配!
 爱华网
爱华网


