Fourier transform infrared spectroscopy
From Wikipedia, the free encyclopedia
Jump to: navigation, search
"FTIR" redirects here. FTIRmay also refer to Frustrated total internal reflection.
Fourier transform infrared spectroscopy(FTIR)[1]is a technique which is used to obtain an infrared spectrumof absorption, emission, photoconductivityor Ramanscattering of a solid, liquid or gas. An FTIR spectrometersimultaneously collects spectral data in a wide spectral range.This confers a significant advantage over a dispersivespectrometer which measures intensity over a narrow range ofwavelengths at a time. FTIR has made dispersive infraredspectrometers all but obsolete[citationneeded] (except sometimes in the near infrared),opening up new applications of infraredspectroscopy.
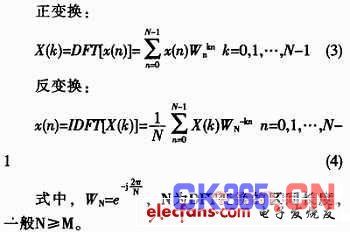
The term Fourier transform infrared spectroscopyoriginates from the fact that a Fouriertransform (a mathematical process) is required to convert theraw data into the actual spectrum. For other uses of this kind oftechnique, see Fouriertransform spectroscopy.
Contents
Conceptual introduction
An FTIR interferogram. The central peak is at the ZPD position("Zero Path Difference" or zeroretardation) where the maximum amount of light passes through theinterferometerto the detector.
The goal of any absorptionspectroscopy (FTIR, ultraviolet-visible("UV-Vis") spectroscopy,etc.) is to measure how well a sample absorbs light at eachwavelength. The most straightforward way to do this, the"dispersive spectroscopy"technique, is to shine a monochromaticlight beam at a sample, measure how much of the light is absorbed,and repeat for each different wavelength. (This is how UV-Visspectrometers work, for example.)
Fourier transform spectroscopy is a less intuitive way to obtainthe same information. Rather than shining a monochromatic beamof light at the sample, this technique shines a beam containingmany frequencies of light at once, and measures how much of thatbeam is absorbed by the sample. Next, the beam is modified tocontain a different combination of frequencies, giving a seconddata point. This process is repeated many times. Afterwards, acomputer takes all these data and works backwards to infer what theabsorption is at each wavelength.
The beam described above is generated by starting with abroadbandlight source—one containing the full spectrum of wavelengths to bemeasured. The light shines into a Michelsoninterferometer—a certain configuration of mirrors, one of whichis moved by a motor. As this mirror moves, each wavelength of lightin the beam is periodically blocked, transmitted, blocked,transmitted, by the interferometer, due to waveinterference. Different wavelengths are modulated at differentrates, so that at each moment, the beam coming out of theinterferometer has a different spectrum.
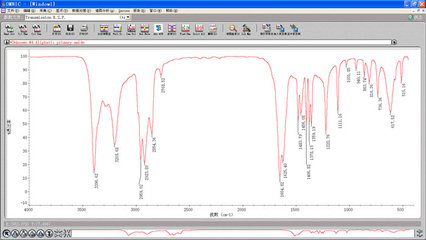
As mentioned, computer processing is required to turn the rawdata (light absorption for each mirror position) into the desiredresult (light absorption for each wavelength). The processingrequired turns out to be a common algorithm called the Fouriertransform (hence the name, "Fourier transformspectroscopy"). The raw data is sometimes calledan "interferogram".
Developmental background
The first low-cost spectrophotometercapable of recording an infraredspectrum was the Perkin-ElmerInfracord produced in 1957.[2]This instrument covered the wavelength range from 2.5 μm to 15 μm(wavenumberrange 4000 cm−1 to 660 cm−1). The lowerwavelength limit was chosen to encompass the highest knownvibration frequency due to a fundamental molecularvibration. The upper limit was imposed by the fact that thedispersingelement was a prism made froma single crystal of rock-salt (sodium chloride)which becomes opaque at wavelengths longer than about 15 μm; thisspectral region became known as the rock-salt region. Laterinstruments used potassiumbromide prisms to extend the range to 25 μm (400cm−1) and caesium iodide 50μm (200 cm−1). The region beyond 50 μm (200cm−1) became known as the far-infrared region; at verylong wavelengths it merges into the microwave region.Measurements in the far infrared needed the development ofaccurately ruled diffractiongratings to replace the prisms as dispersing elements sincesalt crystals are opaque in this region. More sensitive detectorsthan the bolometer wererequired because of the low energy of the radiation. One such wasthe Golaydetector. An additional issue is the need to excludeatmospheric water vapourbecause water vapour has an intense pure rotationalspectrum in this region. Far-infrared spectrophotometers werecumbersome, slow and expensive. The advantages of the Michelsoninterferometer were well-known, but considerable technicaldifficulties had to be overcome before a commercial instrumentcould be built. Also an electronic computer was needed to performthe required Fourier transform and this only became practicablewith the advent of mini-computers,such as the PDP-8which became available in 1965. Digilab pioneered the world's firstcommercial FTIR spectrometer (Model FTS-14) in 1969 [3] (Digilab FTIRs are now a part of Agilenttechnologies's molecular product line after it acquiredspectroscopy business from Varian).[4][5]
Michelson interferometer
Main article: Michelsoninterferometer
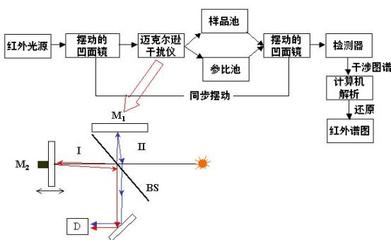
Schematic diagram of a Michelson interferometer, configured forFTIR
In a Michelsoninterferometer adapted for FTIR, light from the polychromaticinfrared source, approximately a black-body radiator,is collimatedand directed to a beam splitter.Ideally 50% of the light is refracted towards the fixed mirror and50% is transmitted towards the moving mirror. Light is reflectedfrom the two mirrors back to the beam splitter and (ideally) 50% ofthe original light passes into the sample compartment. There, thelight is focused on the sample. On leaving the sample compartmentthe light is refocused on to the detector. The difference inoptical path length between the two arms to the interferometer isknown as the retardation. An interferogram is obtained by varyingthe retardation and recording the signal from the detector forvarious values of the retardation. The form of the interferogramwhen no sample is present depends on factors such as the variationof source intensity and splitter efficiency with wavelength. Thisresults in a maximum at zero retardation, when there is constructiveinterference at all wavelengths, followed by series of"wiggles". The position of zeroretardation is determined accurately by finding the point ofmaximum intensity in the interferogram. When a sample is presentthe background interferogram is modulated by the presence ofabsorption bands in the sample.
There are two principal advantages for an FT spectrometercompared to a scanning (dispersive) spectrometer.[6][7]
- The multiplex or Fellgett'sadvantage. This arises from the fact that information from allwavelengths is collected simultaneously. It results in a higherSignal-to-noiseratio for a given scan-time or a shorter scan-time for a givenresolution.
- The throughput or Jacquinot's advantage. This results from thefact that, in a dispersive instrument, the monochromator hasentrance and exit slits which restrict the amount of light thatpasses through it. The interferometer throughput is determined onlyby the diameter of the collimated beam coming from the source.
Other minor advantages include less sensitivity to straylight,[7]and "Connes' advantage" (betterwavelength accuracy),[7]while a disadvantage is that FTIR cannot use the advancedelectronic filtering techniques that often makes itssignal-to-noise ratio inferior to that of dispersivemeasurements.[7]
Resolution
The interferogram belongs in the length domain. Fouriertransform (FT) inverts the dimension, so the FT of theinterferogram belongs in the reciprocal length domain, that is thewavenumberdomain. The spectralresolution in wavenumbers per cm is equal to the reciprocal ofthe maximum retardation in cm. Thus a 4 cm−1 resolutionwill be obtained if the maximum retardation is 0.25 cm; this istypical of the cheaper FTIR instruments. Much higher resolution canbe obtained by increasing the maximum retardation. This is not easyas the moving mirror must travel in a near-perfect straight line.The use of corner-cubemirrors in place of the flat mirrors is helpful as an outgoing rayfrom a corner-cube mirror is parallel to the incoming ray,regardless of the orientation of the mirror about axesperpendicular to the axis of the light beam. Connes measured in1966 the temperature of the atmosphere of Venus by recording thevibration-rotationspectrum of Venusian CO2 at 0.1 cm−1resolution.[8]Michelsonhimself attempted to resolve the hydrogen Hα emissionband in the spectrum of a hydrogen atom into itstwo components by using his interferometer.[1]p25 A spectrometer with 0.001 cm−1 resolutionis now available commercially. The throughput advantage isimportant for high-resolution FTIR as the monochromator in adispersive instrument with the same resolution would have verynarrow entrance and exit slits.
Beam splitter
The beam-splitter can not be made of a common glass, as it isopaque to infrared radiation of wavelengths longer than about 2.5μm. A thin film, usually of a plastic material, is used instead.However, as any material has a limited range of opticaltransmittance, several beam-splitters are used interchangeably tocover a wide spectral range.
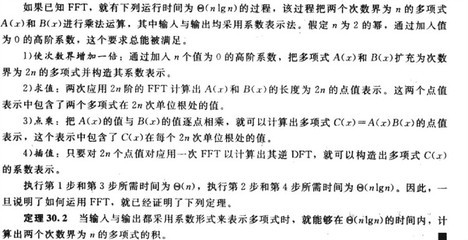
Fourier transform
The interferogram in practice consists of a set of intensitiesmeasured for discrete values of retardation. The difference betweensuccessive retardation values is constant. Thus, a discreteFourier transform is needed. The fast Fouriertransform (FFT) algorithm is used.
Far-infrared FTIR
The first FTIR spectrometers were developed for far-infraredrange. The reason for this has to do with the mechanical toleranceneeded for good optical performance, which is related to thewavelength of the light being used. For the relatively longwavelengths of the far infrared (~10 μm), tolerances are adequate,whereas for the rock-salt region tolerances have to be better than1 μm. A typical instrument was the cube interferometer developed atthe NPL[9]and marketed by Grubb Parsons. Itused a stepper motor to drive the moving mirror, recording thedetector response after each step was completed.
Mid-infrared FTIR
With the advent of cheap microcomputers itbecame possible to have a computer dedicated to controlling thespectrometer, collecting the data, doing the Fourier transform andpresenting the spectrum. This provided the impetus for thedevelopment of FTIR spectrometers for the rock-salt region. Theproblems of manufacturing ultra-high precision optical andmechanical components had to be solved. A wide range of instrumentsare now available commercially. Although instrument design hasbecome more sophisticated, the basic principles remain the same.Nowadays, the moving mirror of the interferometer moves at aconstant velocity, and sampling of the interferogram is triggeredby finding zero-crossings in the fringes of a secondaryinterferometer lit by a helium-neonlaser. This confers high wavenumber accuracy on the resultinginfrared spectrum and avoids wavenumber calibrationerrors.
Near-infrared FTIR
Main article: Near-infraredspectroscopy
The near-infrared region spans the wavelength range between therock-salt region and the start of the visible regionat about 750 nm. Overtones offundamental vibrations can be observed in this region. It is usedmainly in industrial applications such as process controland chemicalimaging.
Applications
FTIR can be used in all applications where a dispersivespectrometer was used in the past (see external links). In addition, the multiplex and throughputadvantages have opened up new areas of application. Theseinclude:
References
- ^ ab Griffiths, P.; de Hasseth, J.A. (18May 2007). Fourier Transform Infrared Spectrometry (2nd ed.).Wiley-Blackwell. ISBN0-471-19404-2.
- ^ "The Infracord double-beamspectrophotometer". Clinical Science16 (2). 1957.
- ^ {http://books.google.co.in/books?id=ZecrNiUkHToC&pg=PA100&lpg=PA100&dq=Digilab+++first+commercial+FTIR&source=bl&ots=5kaX5xpGX4&sig=mc8ClC39zazR6_5_wNI6wXCx9KE&hl=en&sa=X&ei=4Co2UcrqHMnEtAb50IAQ&ved=0CFkQ6AEwCTgK#v=onepage&q=Digilab+ first commercial FTIR&f=false}
- ^ {http://www.agilent.com/about/newsroom/presrel/varian/2004/15sep-v04044.htm}
- ^ {http://www.agilent.co.in/about/newsroom/presrel/2009/27jul-gp09016.html}
- ^ Banwell, C.N.; McCash, E.M. (1994). Fundamentals ofMolecular Spectroscopy (4th ed.). McGraw-Hill. ISBN0-07-707976-0.
- ^ abcde Robert White (1990). Chromatography/Fourier transform infrared spectroscopy and itsapplications. Marcel Dekker. ISBN0-8247-8191-0.
- ^ Connes, J.; Connes, P. (1966)."Near-Infrared Planetary Spectra by FourierSpectroscopy. I. Instruments and Results".Journal of the Optical Society of America 56 (7):896–910. doi:10.1364/JOSA.56.000896.
- ^ Chamberain, J.; Gibbs,J.E.; Gebbie, H.E. (1969)."The determination of refractive index spectra byfourier spectrometry". Infrared Physics9 (4): 189–209. Bibcode:1969InfPh...9..185C.doi:10.1016/0020-0891(69)90023-2.
- ^ Nishikida, K.; Nishio, E.; Hannah, R.W. (1995). Selected applications of FT-IR techniques. Gordon andBreach. p. 240. ISBN2-88449-073-6.
- ^ Beauchaine, J.P.; Peterman, J.W.; Rosenthal,R.J. (1988)."Applications of FT-IR/microscopy in forensicanalysis". Microchimica Acta 94(1-6): 133–138. doi:10.1007/BF01205855.
- ^ Prati, S.; Joseph, E.; Sciutto, G.; Mazzeo, R. (2010)."New Advances in the Application of FTIRMicroscopy and Spectroscopy for the Characterization of ArtisticMaterials". Acc. Chem. Res. 43 (6):792–801. doi:10.1021/ar900274f.PMID20476733.
- ^ Michael Gaft, Renata Reisfeld, Gérard Panczer (2005).Luminescence spectroscopy of minerals and materials.Springer. p. 263. ISBN3-540-21918-8.
- ^ Jef Poortmans, Vladimir Arkhipov (2006). Thin film solar cells: fabrication, characterization andapplications. John Wiley and Sons. p. 189. ISBN0-470-09126-6.