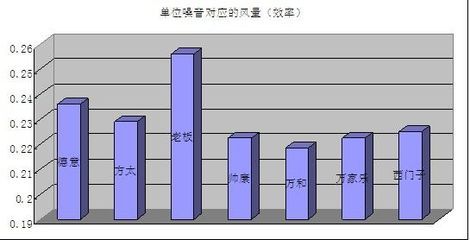
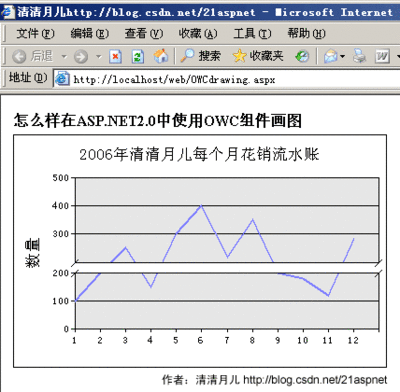
效果如下:

code如下:
set.seed(10086)n <- 200df <- 6X <- rchisq(n,df)xllim = 0xrlim = round(max(X))+2x = seq(xllim, xrlim, length=400)y <- dchisq(x, df)z <- pchisq(x, df)
windows()par(mfrow=c(2,2),oma = c(0, 0, 3, 0))hist(X, breaks=40, freq=FALSE, main = "Histogram of X", xlab ="X")lines(x, y, type="l", col = "red", lwd=2)arrows(10, 0.06, 13, 0.12, code=1, length=0.1, angle=30,col="red", lwd=1.5)text(13, 0.14, "True Density", col="red")
plot(ecdf(X), do.p=FALSE, main = "Empirical CDF of X", xlab ="X", ylab = "CDF")lines(x, z, type="l", col = "red", lwd=2)arrows(12, 0.6, 7.5, 0.6, code=2, length=0.1, angle=30,col="red", lwd=1.5)text(17, 0.6, "True CDF", col="red")
psample <- rank(X)/(length(X)+1)ppopulation <- pchisq(X, df)plot(ppopulation, psample, main = "Chisquared P-P Plot", xlab= "Theoretical Percentiles", ylab = "Sample Percentiles")lines(0:1, 0:1, type="l", col = "red", lwd=2)
qsample <- Xqpopulation <- qchisq(psample, df)plot(qpopulation, qsample, main ="Chisquared Q-Q Plot", xlab = "Theoretical Quantiles", ylab ="Sample Quantiles")lines(c(xllim:xrlim), c(xllim:xrlim), type="l", col = "red",lwd=2)
mtext("Statistical Plots of Chisquared Random Variable(D.F.=6, sample size=200)", font = 2, outer=TRUE)
 爱华网
爱华网


